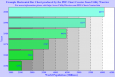
Candlestick Chart
Advertisement
AnyStock Stock and Financial JS Charts v.8.7.0
AnyStock Stock and Financial JS Charts is a flexible JavaScript charting library to visualizing large data sets in interactive HTML5 charts. Designed to display date/time information it offers various chart types, drawing tools, technical indicators.
Advertisement
Financial Charting Component
Financial Charting Component (standard edition) is written in 100 percent C sharp with cutting edge .NET technology. In addition to its striking visual effects, it has a variety of features including charts with pan and zooming charting features: Point
CandleScanner Intraday v.4.1
CandleScanner is a technical analysis software package created for investors interested in Japanese candle patterns. What makes this application exceptional is that it has been specifically designed for the detection of Japanese candle patterns.

CandleScanner v.4.3.0.5
CandleScanner is a technical analysis software package created for investors interested in Japanese candle patterns. What makes this application exceptional is that it has been specifically designed for the detection of Japanese candle patterns.
ShareInvestor Station v.6.1.0.690
ShareInvestor Station is a state-of-the-art real time market quotes, news and charting software designed specially for sophisticated investors.
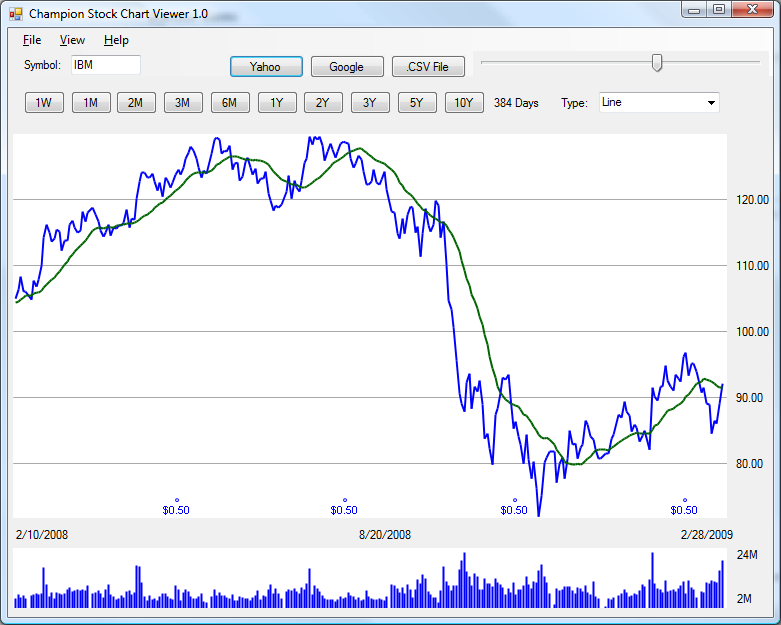
Champion Stock Chart Viewer v.1.01
The Champion Stock Chart Viewer is a free stock chart viewing application for Windows.

Aspose.Chart for .NET
Aspose.Chart is a .NET charting component that can create more than 20 chart types like: area, bar, doughnut, line, pie, point, step, bubble, candlestick, cube, curve, CurveArea, gantt, scatter, contour, HighLowClose, OpenHighLowClose and pareto chart

Swiftchart: chart, graph java applet
Chart java applet software to generate dynamic charts and graphs - bar, line, pie, stacked and grouped charts in 2D and 3D with a wide range of parameters and chart types. Main features: Charts in 2D/3D, Anti aliasing, Multi language support, Cross

Java Chart Designer
Create professionally looking presentations and reports with Java Chart Designer. Feature rich and powerful application gives you full power to create outstanding report and presentation projects. A user-friendly interface, great number of visual effects
PDF Chart Creator Dynamic Link Library
The PDF Chart Creator Dynamic Link Library is a utility that will create charts from data as a PDF document. The conversion process is fully controlled through the provided Application Programming Interface and the royalty free DLL can be included and
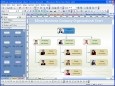
Edraw Organizational Chart v.7.8
Edraw is a new organization chart drawing software, which creates organisation charts and business charts with minimum time loss for you. Support basic flowcharts, organizational charts, business charts, hr diagram and work flowchart.